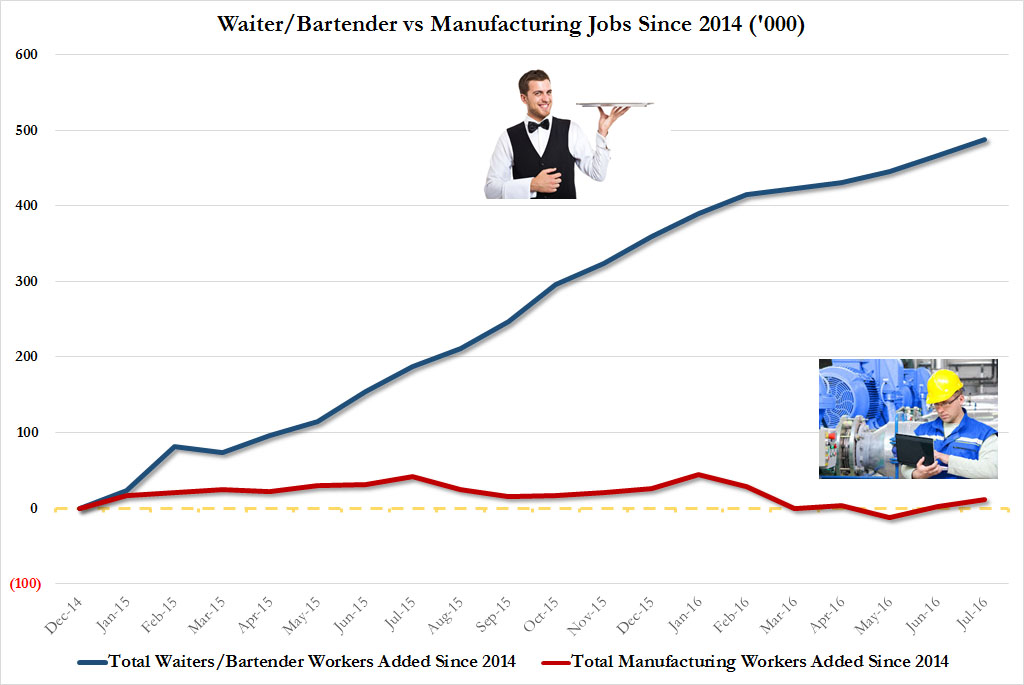
As part of our monthly tradition showing the gaping disparity in the quality of the US labor market, we present the breakdown between the lowest paid jobs available, those for workers in “food services and drinking places”, also known as waiters and bartenders, and compare them to the number of workers in the traditionally best paid sector, manufacturing.
Here is the bottom line: as the chart below shows, there have been half a million waiter and bartender jobs added since 2014, and no manufacturing jobs.
This explains why contrary to the BLS’s seasonally adjusted models optimistically showing a pick up in wage growth, the US economy has so far failed to observe any form of benign demand-pull inflation.
So what accounts for this troubling deteriorationg in the US labor market continue every single month? Here is one explanation.
Back in January, the ECRI’s Lakshman Achuthan’s made a troubling observation. The sustained decline in the official jobless rate – now near the Fed’s estimate of “full employment” – is a misleading indicator of labor market health, he said.
Indeed, the stagnation in nominal wage growth is consistent with the weakness in the employment/population (E/P) ratio. After dropping to three-decade lows in the wake of the Great Recession, the E/P ratio has barely improved since the fall of 2013, reversing only a quarter of its decline from its pre-recession highs. Furthermore – as a breakdown of the E/P ratio by education level shows – even this modest improvement is illusory.
Since 2011, when the E/P ratio for those with less than a high school diploma bottomed, that metric has now regained all of its recessionary losses (green line). But the E/P ratio for high school or college graduates – i.e., eight out of nine American adults – has not recovered any of its recessionary losses, and has barely budged in four years (red line).
We have updated the chart below and it looks as follows:

Unfortunately, this data underscores how the jobs recovery has been spearheaded by
cheap labor, with job gains going disproportionately to the least
educated — and lowest-paid — workers, many of whom have to work multiple
jobs to make ends meets.It also means that while the BLS can liberally apply seasonal adjustment lipstick on the unadjusted payrolls report to make it more attractive, the truth for most Americans is that the so-called recovery continue to escape most working-age Americans. The only good news is that restaurant workers appear to still be hiring… at least until all new waiters are replaced by robots.
* * *
PayPal: Donate in USD
PayPal: Donate in EUR
PayPal: Donate in GBP