Related info:
– 93 Million Americans Remain Out Of The Labor Force Despite Nearly 400K Work Pool Increase
– What’s The Real Unemployment Rate In The US? (Of Two Minds, June 16, 2015):
By my reckoning, roughly 60% of the civilian work force is fully employed and 40% are marginally employed or unemployed.
Officially, the unemployment rate in the U.S. is 5.6%, meaning 5.6% of the work force is temporarily out of a job and actively seeking another one. This low number reflects nearly full employment, as 3% to 4% of the work force is typically in the process of quitting/being laid off and finding another job.
Typically, periods of nearly full employment are economically good times, as household income is bolstered and employers have to pay a bit more to hire workers when the labor market is tight.
But these do not feel like good times for most households, despite the low unemployment rate. Earnings are stagnant for 90% of the work force, and employers are only paying a competitive premium for workers in very select fields (programmers adept at Python and mobile user interfaces, etc.)
This creates a cognitive dissonance between the low official unemployment rate and the real economy, which is behaving like an economy with much higher rates of unemployment, i.e. sluggish hiring, stagnant wages, difficulty in finding jobs, and very little pressure on employers to pay more for typical jobs.
Let’s start by trying to calculate the work force–the number of people who could get a job if they wanted to. This isn’t quite as straightforward as we might imagine, because the two primary agencies that compile these statistics use slightly different categories.
The Bureau of Labor Statistics (BLS) calculates the civilian noninstitutional population as everyone 16 and older who is not in active-duty military service or in prison. The BLS reckons this to be about 250 million people, out of a total population of about 317 million residents: Household Data (BLS)
The BLS subtracts 93 million people who are not in the labor force, leaving about 157 million people in the civilian work force–roughly half the nation’s population.
Of these, 148.8 million have a job of some sort and 8.6 million are unemployed.
The Census Bureau calculates the civilian noninstitutional population as everyone who is not in active-duty military service or in prison. (You can download various data on the U.S. population on this Census Bureau website: Age and Sex Composition in the United States: 2012. I am using Table 1 data.)
The Census Bureau places the civilian noninstitutional population at 308.8 million in 2012. Since roughly 4 million people are born and 2.6 million die in the U.S. each year, we can adjust this upward by roughly 3.5 million to bring it up to date (mid-2015) to 312 million.
About 74 million people are 17 and younger, and 36 million are 68 and older. Given that the full-benefit retirement age for Social Security is pushing 67, I am using 67 as the cut-off for the work force rather than the traditional 65.
This is of course a squishy calculation, as many people retire at 62 and others work beyond the age of 70. But given the strong employment trends of the over-65 cohort, I think it fair and reasonable to include everyone between 18 and 67 in the work force.
Subtracting 110 young people and retirees leaves a civilian work force of around 200 million people. Let’s then subtract those who can’t work or choose not to work for conventional reasons. There are roughly 8 million people on permanent disability and several million more at any one time on temporary disability, so let’s subtract 10 million disabled.
Next, let’s subtract stay-at-home parents. Since there are 20 million children under the age of 5, let’s reckon 20 million adults will on average choose to leave the work force to care for their children full-time.
Should this number be 40 million? What about home-schooling? Given the possibilities for part-time, home-based and free-lance work, I am reluctant to conclude everyone caring for or schooling their children cannot possibly earn some income. But let’s consider adding another 10 million adults who may be caring for their families (seniors as well as children) at home full-time.
While it may seem as if every other hipster in town is a trust funder, i.e. a person who draws upon inherited wealth and doesn’t need to work, Internal Revenue Service (IRS) data reports less than 2 million people draw substantial incomes from trusts. Since even those with unearned income can still perform work, I include trust funders in the work force.
If we subtract 10 million disabled and 30 million stay-at-home parents, we have a work force of around 160 million–not far from the BLS number of 157 million. If we use a smaller number of full-time stay-at-home parents, then perhaps the work force is closer to 170 million.
The BLS calculates what it calls labor force participation rate–63% of the total civilian noninstitutional population is in the labor force.
The next issue is what we reckon qualifies as a job. In general, the BLS and the Census Bureau count anyone with earned income as employed. The BLS reckons 148.8 million people have jobs, but this includes 23 million people who earn less than $5,000 annually. The Social Security Administration (SSA) states that 155 million people reported taxable income, which includes not just earnings (wages and salaries) but distributions from retirement funds, IRAs, etc. that are taxable. Wage Statistics for 2013.
The question boils down to this: should we count someone who earns $1,000 a year as employed? How about someone who earns $5,000? At what point does an income enable a person to support himself/herself? Should we place those earning incomes far below a living income in the same category as those with full-time jobs/incomes?
This is where I part company from the government agencies’ classification of any earned income in any amount as qualifying as a job. If I am a consultant earning less than $5,000 annually, clearly I cannot support myself on this income. If I earn $2,500 annually in part-time free-lancing, this is at best 10% of poverty-level income for a household in a low-cost region; in a high-cost region, it is perhaps 5% of poverty-level income.
The BLS attempts to define a broader definition of under-employment and unemployment in its categoryU-6 Total unemployed, plus all persons marginally attached to the labor force, plus total employed part time for economic reasons, as a percent of the civilian labor force plus all persons marginally attached to the labor force: this is 10.8% of the work force.
Depending on how we calculate the work force, and if we count everyone with any earnings as employed, we get an unemployment rate of somewhere between 5.6% and 12.5%. If we use the BLS’s metric for including under-employment, this is in the range of 10% to 15%.
Common sense suggests that we calculate employment/unemployment based on earnings, not just any income in any amount. If we reckon that only those with earnings of $15,000 or more annually (roughly speaking, full-time work at minimum wage) are fully employed, then the numbers change dramatically.
The $15,000 annual earnings are also a rough benchmark of self-supporting households: two wage-earners making $15,000 each would have a household income of $30,000–enough to get by in much of the country.
About 50 million people earn less than $15,000 annually. This includes roughly 10 million self-employed and 40 million with part-time jobs or other sources of earned income. This suggests that only 100 million of the 160 million work force are fully employed in the sense of not just having a job but making enough to be self-supporting.
There are many caveats resulting from the way that government social welfare is not included in earnings: thus a household might have two part-time wage-earners making very modest sums monthly who are getting by because they qualify for Section 8 housing, SNAP food stamps, Medicaid healthcare, school lunch programs, and so on. These programs enable the working poor to support a household despite low earnings.
Should we include those depending on social welfare programs as fully employed?
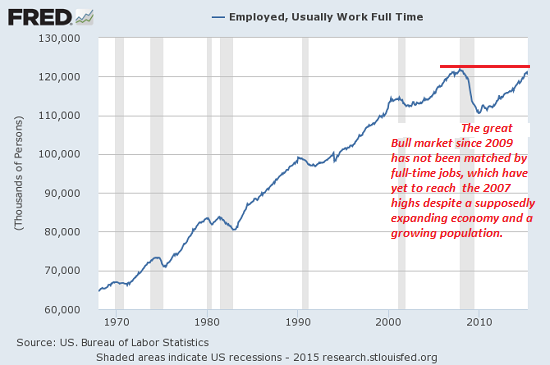
By my reckoning, roughly 60% of the civilian work force is fully employed and 40% are marginally employed (i.e. earning less than $15,000 annually) or unemployed. Since full-time workers even at minimum wage earn close to $15,000 annually, I think it is fair to use that as the cut-off for fully employed. The BLS counts 121 million people asusually work full-time, but given only 100 million workers earn $15,000 or more, this doesn’t add up unless we include self-employed people earning very little who are counted as full-time workers.
Based on income, I set the fully employed rate at 60%, and the marginally employed/unemployed rate at 40%. If we accept the BLS’s 121 million full-time jobs (which once again, this doesn’t make sense given even minimum wage full-time jobs earn $14,500, and 50 million people report earnings of less than $15,000), we still get a marginally employed/unemployed rate of 25%: work force of 160 million, 121 million fully employed.
These numbers align much better with the real economy than the official unemployment rate of 5.6%. It’s nonsense to count everyone earning a few hundred or few thousand dollars annually as being employed in the same category as full-time workers or those earning $15,000 or more annually.
The real unemployment rate is between 33-38%, and the statistics in this article support these facts. 100 million fully employed people out of a total population of 316 million. Deducting 110 million under 17 or over 67……..deducting more of those who are disabled……..the real numbers seem to work out the same.
I don’t know how much longer this can go on. There is no real growth in any field but debt………Stores are closing, real prices are going up especially in food and other essentials….
It was Kettering, one of the key people in early GM days who said it best….no company or organization can grow endlessly……..without a strong economy to support growth, the truth becomes an empty shell, and that is what we have in the US, and the entire western economy.
Should Greece default, the fallout from the Enron Accounting of the other Euro nations will cause a backlash that will be far more harsh than most people realize. This is why the greedy gut bankers are mute on the subject of Greece.
Why they are so quiet on Russia’s role is also disturbing…………Russia stepping in to use Greece’s ports ought to grow the Greek and Russian economies…….why the bankers carry on as if Russia was doing nothing is a puzzle to me.
There is a lot going on nobody will discuss the truth about….the de-dollarization of the eastern economy, ETC.
Real unemployment in the US has remained at its present rate for several years now…….