– Obviously Not A Bubble (ZeroHedge, Sep 4, 2014):
Just two charts…
Via John Hussman… no bubble, no consequences…
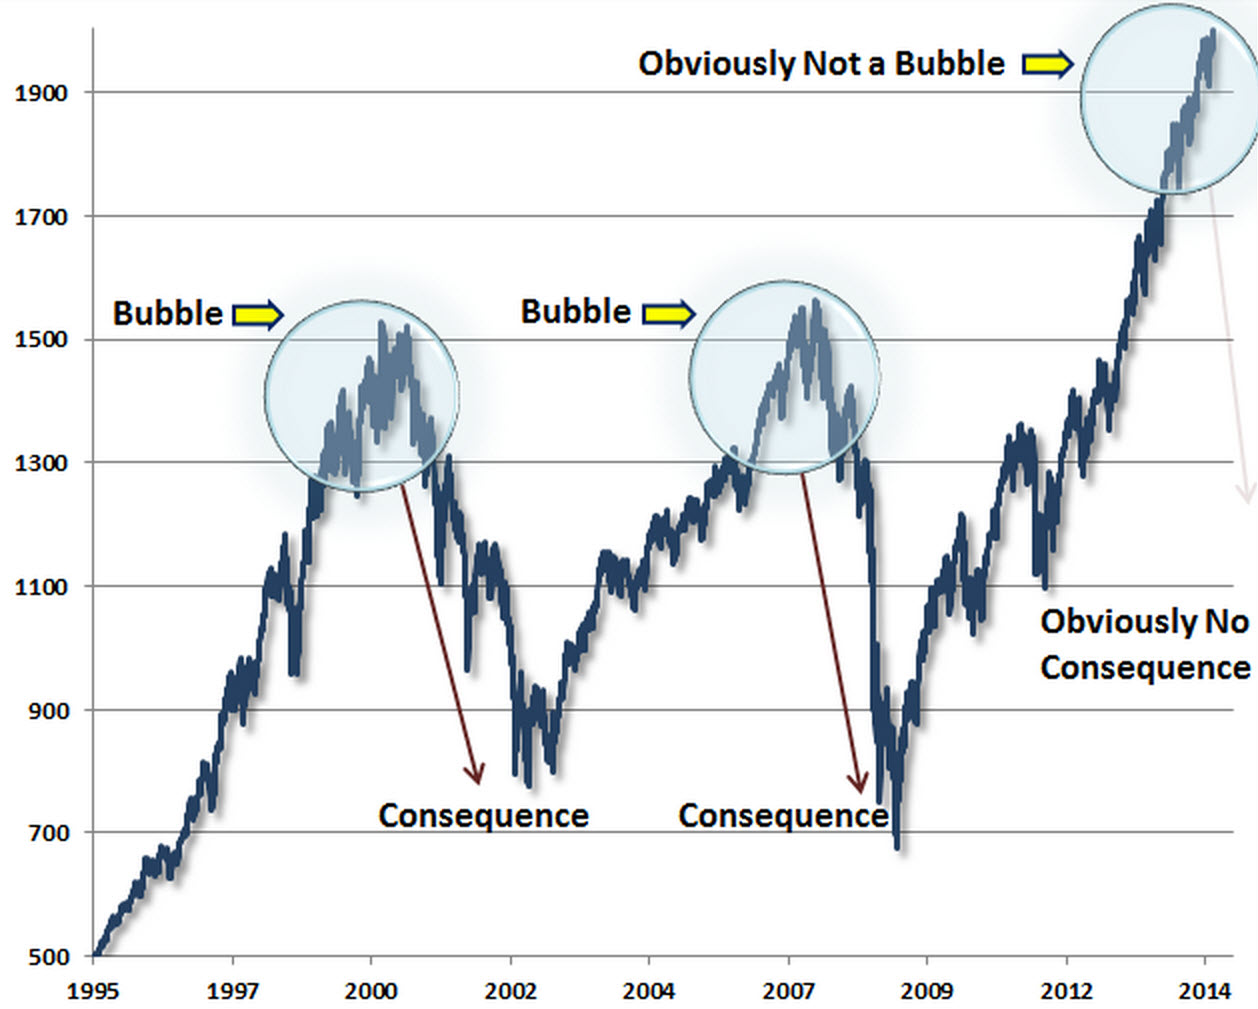
and Via NewEdge’s Brad Wishak… realized volatility has only been lower once since 2006…
The man who trades freedom for security does not deserve nor will he ever receive either. – Benjamin Franklin
– Obviously Not A Bubble (ZeroHedge, Sep 4, 2014):
Just two charts…
Via John Hussman… no bubble, no consequences…
and Via NewEdge’s Brad Wishak… realized volatility has only been lower once since 2006…
– It’s Settled: Central Banks Trade S&P500 Futures (ZeroHedge, Aug 30, 2014):
Based on the unprecedented collapse in trading volumes of cash products over the past 6 years, one thing has become clear: retail, and increasingly, institutional investors and traders are gone, probably for ever and certainly until the Fed’s market-distorting central planning ends. However, one entity appears to have taken the place of conventional equity traders: central banks.
Courtesy of an observation by Nanex’s Eric Hunsader, we now know, with certainty and beyond merely speculation by tinfoil fringe blogs, that central banks around the world trade (and by “trade” we mean buy) S&P 500 futures such as the E-mini, in both futures and option form, as well as full size, and micro versions, in addition to the well-known central bank trading in Interest Rates, TSY and FX products.
From the article:
“Because one can just as easily make the case that as the global financial house of cards, teetering since the great financial crisis of 2008, and upright only thanks to the explicit “wealth effect” support of the final backstop – the world’s money printers – any protracted downward move which implicitly crushes the faith in the monetary religion, and crushes the uber-leveraged smart money community, will make the “drawdown” in both momo and S&P500 stocks in March 2000 seem like a pleasant walk in the part compared to what may be coming.”
– “Shadows Of March 2000” – Goldman On The Great Momo Crash Of 2014 (Zerohedge, April 14, 2014):
Behold the great momo basket which after being the source of so much joy for momentum chasers over the past year, has mutated into the source of so much sorrow over the past two weeks.

We have bad news for hedge funds who, like Hugh Hendry in December of last year, threw fundamentals and caution to the wind and, with great reservations, jumped into this momo bandwagon in which mere buying beget more buying until nobody knew why anyone bought in the first place… and then everything crashed, leading to the worst day for hedge funds in a decade: according to Goldman’s David Kostin, whose job is to be a cheerleader for the intangible “wealth effect” leading to all too tangible Goldman bonuses: “The stock market will likely recover during the next few months… but not momentum stocks.”
Behold the (not so) great Momo crash of 2014:
First the bad news: according to Goldman not only will the momo stocks not rebound to previous highs and resume their leadership role, but clients increasingly are wondering if this is the second coming of the dot com bubble burst.
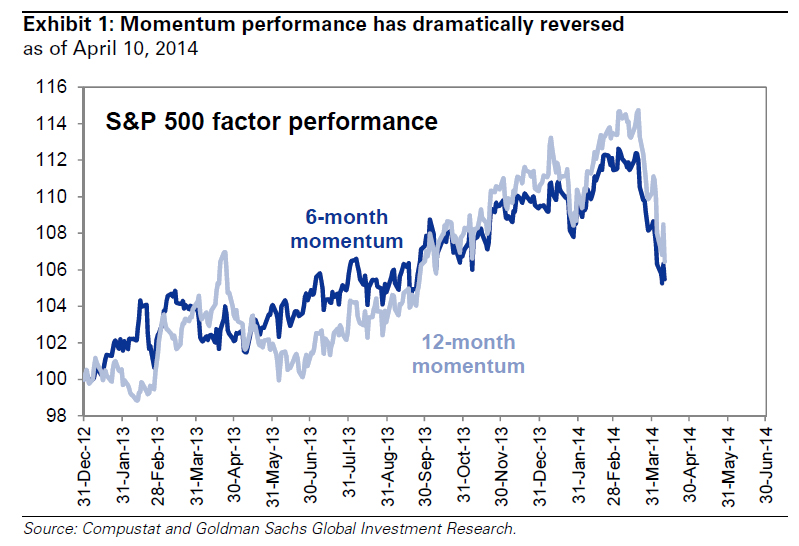
Conversations we are having with clients: Momentum reversal and the shadow of 2000
Our client discussions this week focused on two topics: Momentum reversal and comparisons between today and March 2000. Two questions dominated: “When will the reversal end?” and “Will the sell-off in momentum stocks drive a market-wide price decline as occurred in 2000?”
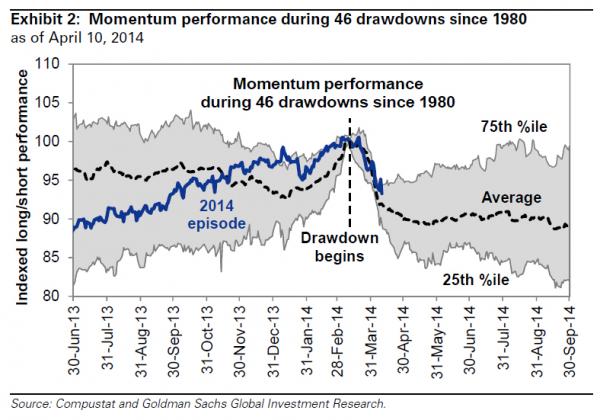
During the past month, momentum has plunged by 7%, a 10th percentile ranking of all monthly momentum returns since 1980. We define “momentum” as the relative performance of the best vs. worst performing S&P 500 stocks during the prior 12 months. We identified 46 similar distinct 10th percentile “drawdowns” with an average one-month return of -8% and a cumulative -10% return during six months.
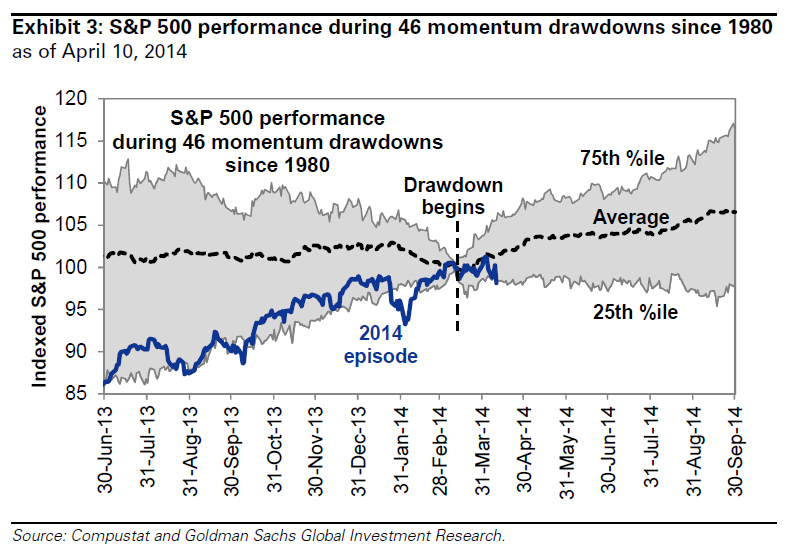
Historical experience suggests the S&P 500, but not momentum, will likely recover during the next few months. Following the drawdowns, S&P 500 posted a 6-month return averaging +5% and delivered a positive return 70% of the time. Momentum declined by a further 4% on average, and 60% of the time the stocks posted a negative return.
Analysis of historical trading patterns around momentum drawdowns shows: (a) roughly 70% of the reversal is behind us following a 7% unwind during the last month; (b) an additional 3% downside exists to the momentum reversal during the next three months if the current episode follows the average historical experience; (c) if the pattern followed the path of a 25th percentile event a further 7% momentum downside would occur, or about double the reversal that has taken place so far; and (d) whenever the drawdown ends, momentum typically does NOT resume leadership. The best performing stocks during the 12 months leading up to the start of the drawdown do not subsequently outperform (see Exhibit 2).
So what are the good news? Well, Goldman is bullish on the non-MOMO stocks, which it sees as rising during the next 6 months by, if history is any precedent, 5%. Of course, the market merely regaining its all time highs by October will hardly please the investor community which is used to 20%+ return year after year. After all someone must benefit from the Fed’s ludicrous actions.
S&P 500 Index performance during 46 momentum reversals since 1980 suggests the broad market will likely rise steadily during the next six months by an average of 5%. Based on a current S&P 500 index level of 1815, a 5% rise would lift the index to just above 1900 which is our year-end 2014 forecast. A 25th percentile trajectory implies a flat equity market during the next six months while tracking at the 75th percentile would see S&P 500 climb by 15% to 2090 by the end of 3Q (see Exhibit 3).
But most interesting is Goldman’s attempt to deny that this is the second coming of March 2000:
One historical momentum drawdown has come up repeatedly in recent conversations with clients: March 2000. The current sell-off in high growth and high valuation stocks, with a concentration in technology subsectors, has some similarities to the popping of the tech bubble in 2000.
Veteran investors will recall S&P 500 and tech-heavy Nasdaq peaked in March 2000. The indices eventually fell by 50% and 75%, respectively. It took the S&P 500 seven years to recover and establish a new high but Nasdaq still remains 25% below its all-time peak reached 14 years ago.
We believe the differences between 2000 and today are more important than the similarities and the recent momentum drawdown is unlikely to
precipitate a more extensive fall in share prices:
- Recent returns are less dramatic. Although the trailing 12-month returns are similar (22% today versus 18% in 2000), the trailing 3-year and 5-year returns are much lower (51% vs. 107% and 161% vs. 227%, respectively).
- Valuation is not nearly as stretched. S&P 500 currently trades at a forward P/E of 16x compared with 25x at the peak in 2000. The price/book ratio is 2.7x versus 6.Xx. The EV/sales is currently 1.8x compared with 2.7x in 2000.
- More balanced market. The reason it is called the “Tech Bubble” is that 14% of the earnings of the S&P 500 came from Tech in 2000 but it accounted for 33% of the equity cap of the index. Today Tech contributes 19% of both earnings and market cap. Top five stocks in 2000 were 18% vs. 11% today.
- Earnings growth expectations are far less aggressive. Bottom-up 2014 consensus EPS growth currently equals 9%, close to our top-down forecast of 8%. In 2000, consensus expected EPS growth equaled 17%.
- Interest rates are dramatically lower. 3-month Treasury yields were 5.9% in 2000 vs. 0.05% today while ten-year yields were 6.0% vs. 2.7% today. The yield curve was inverted by 47 bp. Today the slope equals +229 bp.
- Less new issuance. During 1Q 2000, 115 IPOs were completed for proceeds of $18 billion. In 1Q 2014, 63 completed deals raised $11 billion.
All great points, yet one thing is conspicuously missing and perhaps Goldman can clarify:
- how much debt as a percentage of global GDP was held by the world’s major central banks then and now, and
- how much consolidated global leverage, including shadow banking in both the US and China, as well as how many hundreds of trillions of derivatives notional outstanding existed then… and now
Because one can just as easily make the case that as the global financial house of cards, teetering since the great financial crisis of 2008, and upright only thanks to the explicit “wealth effect” support of the final backstop – the world’s money printers – any protracted downward move which implicitly crushes the faith in the monetary religion, and crushes the uber-leveraged smart money community, will make the “drawdown” in both momo and S&P500 stocks in March 2000 seem like a pleasant walk in the part compared to what may be coming.
– Peak Bubble 2.0: The Market Is Now Exactly As Overvalued As It Was At The Last Bubble Peak (Zerohedge, April 4, 2014):
According to this chart from JPM the market’s forward P/E ratio now is precisely 15.2x. What was it at precisely the last bubble peak on October 9, 2007? 15.2x.
Everyone knows what happened next.
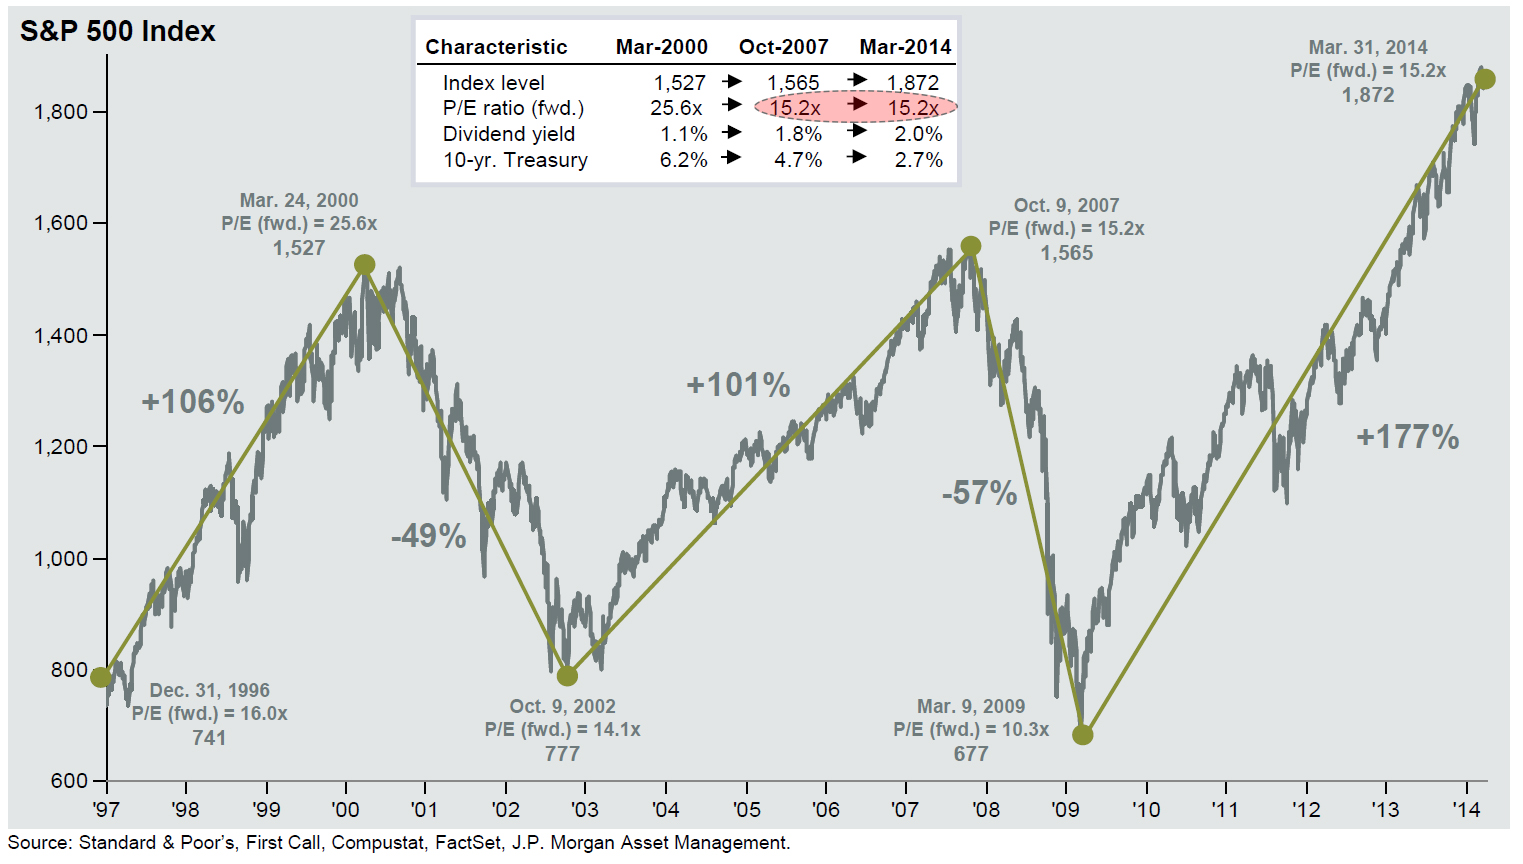
Source: JPM
– Check out these 8 new ‘record highs’. #6 is a real shocker. (Sovereign Man, March 31, 2014):
There’s nothing like a nice cup of reality first thing on Monday morning.
If you’ve been a reader for any length of time, you know one of the things I periodically do is scan headlines for phrases like “record high” or “all time high”.
The results can often given an interesting big picture perspective of what’s happening in the world.
– James Montier: “The Market Is Overvalued By 50%-70%” And “Nothing At All” Is Attractively Valued (ZeroHedge, March 21, 2014):
A month ago we presented a must read interview by Swiss Finanz und Wirtschaft with respected value investor Howard Marks, in which, when explaining the motives driving rational investing he summarized simply, “in the end, the devil always wins.” Today, we are happy to bring our readers the following interview with one of our favorite strategists, GMO’s James Montier, in which true to form, Montier packs no punches, and says that the market is now overvalued by 50% to 70%, adding that there is “nothing at all” that has an attractive valuation, and that he sees a “hideous opportunity set.”
Still, despite the clear bubble in stocks, he is unsure what to do since financial repression could last very long with “the average length of periods of financial repression in history is 22 years. We’ve only had five years so far.” Finally on the topic of Japan and Abenomics, “for me, there is too much hope and expectation embedded in Abe, not unlike Obama in 2009: There was so much hope projected into Obama that he could only disappoint.” He did, well… everyone but the 0.001% billionaires. Then again in a world in which there is only hope left, what happens when that too is removed?
James Montier is a full-blooded value investor. Pickings are slim these days, though, says the member of the asset allocation team at the Boston-based asset manager GMO. He sees a «hideous opportunity set» for investors, with the S&P-500 being overvalued by 50 to 70 percent.
James, are you able to find anything in today’s financial markets that still has an attractive valuation?

Captain Obvious strikes again.
– Hussman Warns S&P 500 Over-Valuation Now Higher Than Housing In 2006 (Zerohedge, March 10, 2014)
– Just 12 WTF Charts (ZeroHedge, Feb 22, 2014)
– Japan Is Re-Crisis-ing; Nikkei Plunges 300 Points From US Close; S&P’s Dead-Cat-Bounce Dead (ZeroHedge, Feb 4, 2014):
US and Japanese stocks began to fall the moment the bell rang in NYC on the end of the US day-session. By the times futures closed 15mins later, the S&P had already lost 6 points and the exuberance in the Nikkei had snapped back to USDJPY reality (100 points off its highs). As the evening progressed the dead-cat-bounce died with US and Japanese stocks tumbling to day-session lows. Dow futures are down 110 from the highs; S&P futures are down 16 points from the US session highs; and Nikkei futures – not helped by the 19th month in a row of falling YoY base wages – are testing 14,050, having dropped 300 points from the highs and removed all day-session gains. Stocks are re-crisis-ing as USDJPY tests back towards 101.
Read moreJapan Is Re-Crisis-ing; Nikkei Plunges 300 Points From US Close; S&P’s Dead-Cat-Bounce Dead
– Why Is Goldman Sachs Warning That The Stock Market Could Decline By 10 Percent Or More? (Economic Collapse, Jan 13, 2014):
Why has Goldman Sachs chosen this moment to publicly declare that stocks are overpriced? Why has Goldman Sachs suddenly decided to warn all of us that the stock market could decline by 10 percent or more in the coming months? Goldman Sachs has to know that when they release a report like this that it will move the market. And that is precisely what happened on Monday. U.S. stocks dropped precipitously. So is Goldman Sachs just honestly trying to warn their clients that stocks may have become overvalued at this point, or is another agenda at work here? To be fair, the truth is that all of the big banks should be warning their clients about the stock market bubble. Personally, I have stated that the stock market has officially entered “crazytown territory“. So it would be hard to blame Goldman Sachs for trying to tell the truth. But Goldman Sachs also had to know that a warning that the stock market could potentially fall by more than 10 percent would rattle nerves on Wall Street.
Read moreWhy Is Goldman Sachs Warning That The Stock Market Could Decline By 10 Percent Or More?
– Greenspan #Timestamped – “Dow 16,000 Is Not A Bubble” (ZeroHedge, Nov 27, 2013):
The maestro clarifies his ‘experienced’ perspective of spotting bubbles in the following quote from his interview with Bloomberg TV’s Al Hunt:
“This does not have the characteristics, as far as I’m concerned, of a stock market bubble,”
Of course, as we noted here, some would beg to differ; but perhaps what would be useful is for the former Fed head to explain what ‘characteristics’ do constitute a bubble…
Nope, no bubble here…

And here’s his explanation…
Read moreGreenspan #Timestamped – ‘Dow 16,000 Is Not A Bubble’
– S&P 500 Plunges To Pre-“Summers Is Out” Levels (ZeroHedge, Sep 27, 2013)
– Consumer Sentiment Plunges To 5-Month Lows; Biggest Miss Of 2013 (ZeroHedge, Sep 27, 2013)
Related info:
– Marc Faber On Today’s 1987 Redux ‘Market May Drop 20% Or More’ (Video)
– 7th Time Was Not The Charm, S&P Tests 1,700 And Dumps (ZeroHedge, Aug 8, 2013):
For the 7th time in the last day or so, the S&P 500 has tested up to the magical 1,700 level and failed. With JPY once against strengthening as carry unwinds re-escalate, we wait breathless for a deja deja deja vu repeat of the last 3 days post-European close rampfest…
as JPY retraces its overnight ramp weakness…

Charts: Bloomberg
– Marc Faber On Today’s 1987 Redux “Market May Drop 20% Or More” (ZeroHedge, Aug 8, 2013):
In a little under 90 seconds, the venerable “Gloom, Boom, and Doom”er draws a number of eery similarities between the fundamental and technical backdrop before 1987’s equity market collapse and the current environment. With the 3rd Hindenburg Omen in 4 days suggesting anxiety is high, maybe he is on to something.
Hindenburg Cluster – 3rd in last 4 days…
and how we look compared to 1987…
Charts: Bloomberg
YouTube Added: 24.05.2013
Description:
My recent presentation to the 66th Annual CFA Conference in Singapore in which I discuss the disconnect between financial markets and mathematical reality
www.vulpesinvest.com
[email protected]
Grant Williams is a portfolio and strategy adviser at Vulpes Investment Management in Singapore. He began his career in finance with Robert Fleming & Co. in London, where he traded Japanese equity warrants. Mr. Williams also worked at Jardine Fleming in Tokyo before returning to Flemings in London, where he helped establish the firm’s pan-Asian convertible trading business. He headed up Asian equity trading at UBS in London and then ran equity trading books at Credit Suisse in New York, Hong Kong, and Sydney. Mr. Williams has a strong focus on precious metals and miners and is a regular speaker at investment conferences around the world. He writes the Things That Make You Go Hmmm… column for Mauldin Economics’ weekly newsletter.
More info on the conference here: 66th CFA Institute Annual Conference
– This Is The S&P With And Without QE (ZeroHedge, May 6, 2013):
…
One final point: for all those who say the Fed’s QE has “been successful”, or the stock market is sufficiently strong and does not need any more forced liquidity injections, here is a simple suggestion: just end it.
…
– What Happened The Last Time We Saw Gold Drop Like This? (ZeroHedge, April 15, 2013):
The rapidity of gold’s drop is impressive, concerning, and disorderly. We have seen two other such instances of disorderly ‘hurried’ selling in the last five years. In July 2008, gold quickly dropped 21% – seemingly pre-empting the Lehman debacle and the collapse of the western banking system. In September 2011, gold fell 20% in a short period – as Europe’s risks exploded and stocks slumped prompting a globally co-ordinated central bank intervention the likes of which we have not seen before. Given the almost-record-breaking drop in gold in the last few days, we wonder what is coming?
This is what it looked like in Q3 2008…
and in 2011…
Read moreWhat Happened Last Time When Gold Dropped Like This?
– Dow Jones At New All Time Highs – Here’s Why (ZeroHedge, April 9, 2013):
Curious why the Dow Jones Industrial Average just hit new all time highs? Here’s a partial list of recent economic events:
- Markit US PMI Miss
- ISM Manufacturing Miss
- ISM New York Miss
- Vehicle Sales Miss
- ADP Employment Miss
- ISM Services Miss
- Challenger Job Cuts Miss
- Initial Claims Miss
- Trade Balance Beat
- Non-Farm Payrolls Miss
- Hourly Earnings Miss
- NFIB Small Business Miss
- Wholesale Inventories Miss
And that’s ignoring the absolute economic collapse in Europe, the Chinese slowdown, and the Japanese economic basketcase.
What is there to even say anymore: Stalingrad 4 Eva! Remember: central planning works.
and if pictures are better than words…
– 1936 Redux – It’s Really Never Different This Time (ZeroHedge, March 14, 2013):
While chart analogs provide optically pleasing (and often far too shockingly correct) indications of the human herd tendencies towards fear and greed, a glance through the headlines and reporting of prior periods can provide just as much of a concerning ‘analog’ as any chart. In this case, while a picture can paint a thousand words; a thousand words may also paint the biggest picture of all. It seems, socially and empirically, it is never different this time as these 1936 Wall Street Journal archives read only too well… from devaluations lifting stocks to inflationary side-effects of money flow and from short-covering, money-on-the-sidelines, Jobs, Europe, low-volume ramps, BTFD, and profit-taking, to brokers advising stocks for the long-run before a 40% decline.Things look eerily similar eh?
But when we look at the headlines in the Wall Street Journal from mid 1936 to mid 1937 as the market topped out (orange oval), dipped, was bought back, then collapsed 40% in 3 months, nothing ever changes…
Government Bailouts Repaid – Bullish Implications…
N.Y. Central Has Repaid All Government Loans
The Wall Street Journal, 978 words
Dec 1, 1936
WASHINGTON Numerous railroad developments here yesterday were climaxed by the announcement of RFC Chairman Jesse H. Jones that New York Central had repaid all of its government loans, totaling $16,858,950, most of which was not due until 1941.


