– “Markets Are Wrong”: Hugh Hendry Shuts Down His Hedge Fund; Here Is His Farewell Letter
* * *
PayPal: Donate in USD
PayPal: Donate in EUR
PayPal: Donate in GBP
The man who trades freedom for security does not deserve nor will he ever receive either. – Benjamin Franklin
FYI.

– “I Used To Be A Big Deal… And Then A Billion Dollars Walked Out The Door” – Hugh Hendry’s Sad Story:
In a somewhat more manic-than-usual introduction to his 2016 macro outlook, Eclectica’s Hugh Hendry – the first of the big bears to throw in the towel and kiss the ring of central planners – admits that things did not turn out quite as he expected, noting “I used to be a big deal”, that “I had $1.5 billion in AUM” and that “life is cruel.”
While the entirety of his presentation is certainly worth watching, what specifically caught our attention were the occasional, and rather troubling, streams of consciousness during which we get a glimpse into Hendry’s current frame of mind and, frankly, we are a little concerned, because while we have no doubt in Hendry’s investing genius (even if he did decide to infamously flipflop in 2013 and many of his LPs decided not to stick with him), the content of what he says is just a little troubling.
Some excerpts:
From the article:
“Because one can just as easily make the case that as the global financial house of cards, teetering since the great financial crisis of 2008, and upright only thanks to the explicit “wealth effect” support of the final backstop – the world’s money printers – any protracted downward move which implicitly crushes the faith in the monetary religion, and crushes the uber-leveraged smart money community, will make the “drawdown” in both momo and S&P500 stocks in March 2000 seem like a pleasant walk in the part compared to what may be coming.”
– “Shadows Of March 2000” – Goldman On The Great Momo Crash Of 2014 (Zerohedge, April 14, 2014):
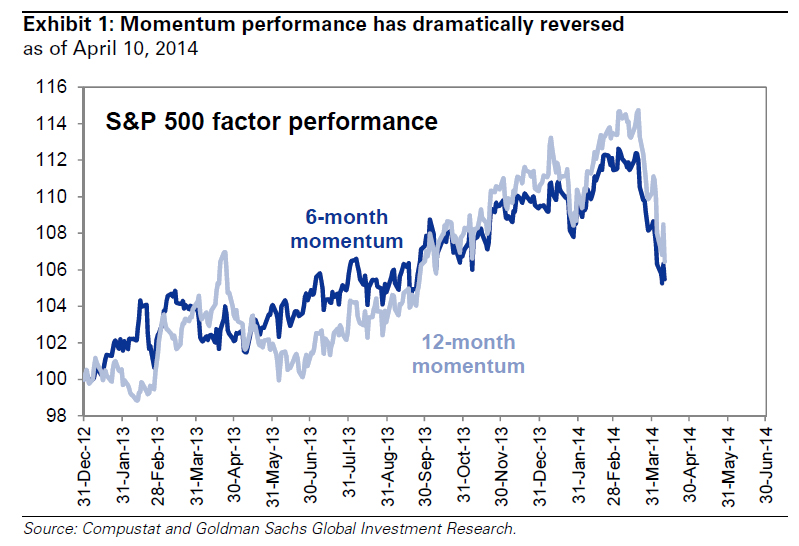
Behold the great momo basket which after being the source of so much joy for momentum chasers over the past year, has mutated into the source of so much sorrow over the past two weeks.

We have bad news for hedge funds who, like Hugh Hendry in December of last year, threw fundamentals and caution to the wind and, with great reservations, jumped into this momo bandwagon in which mere buying beget more buying until nobody knew why anyone bought in the first place… and then everything crashed, leading to the worst day for hedge funds in a decade: according to Goldman’s David Kostin, whose job is to be a cheerleader for the intangible “wealth effect” leading to all too tangible Goldman bonuses: “The stock market will likely recover during the next few months… but not momentum stocks.”
Behold the (not so) great Momo crash of 2014:
First the bad news: according to Goldman not only will the momo stocks not rebound to previous highs and resume their leadership role, but clients increasingly are wondering if this is the second coming of the dot com bubble burst.
Conversations we are having with clients: Momentum reversal and the shadow of 2000
Our client discussions this week focused on two topics: Momentum reversal and comparisons between today and March 2000. Two questions dominated: “When will the reversal end?” and “Will the sell-off in momentum stocks drive a market-wide price decline as occurred in 2000?”
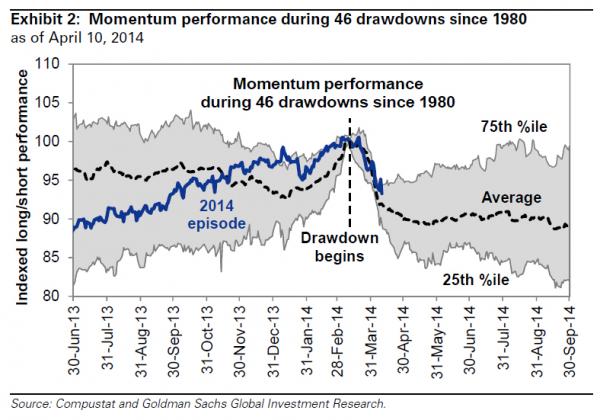
During the past month, momentum has plunged by 7%, a 10th percentile ranking of all monthly momentum returns since 1980. We define “momentum” as the relative performance of the best vs. worst performing S&P 500 stocks during the prior 12 months. We identified 46 similar distinct 10th percentile “drawdowns” with an average one-month return of -8% and a cumulative -10% return during six months.
Historical experience suggests the S&P 500, but not momentum, will likely recover during the next few months. Following the drawdowns, S&P 500 posted a 6-month return averaging +5% and delivered a positive return 70% of the time. Momentum declined by a further 4% on average, and 60% of the time the stocks posted a negative return.
Analysis of historical trading patterns around momentum drawdowns shows: (a) roughly 70% of the reversal is behind us following a 7% unwind during the last month; (b) an additional 3% downside exists to the momentum reversal during the next three months if the current episode follows the average historical experience; (c) if the pattern followed the path of a 25th percentile event a further 7% momentum downside would occur, or about double the reversal that has taken place so far; and (d) whenever the drawdown ends, momentum typically does NOT resume leadership. The best performing stocks during the 12 months leading up to the start of the drawdown do not subsequently outperform (see Exhibit 2).
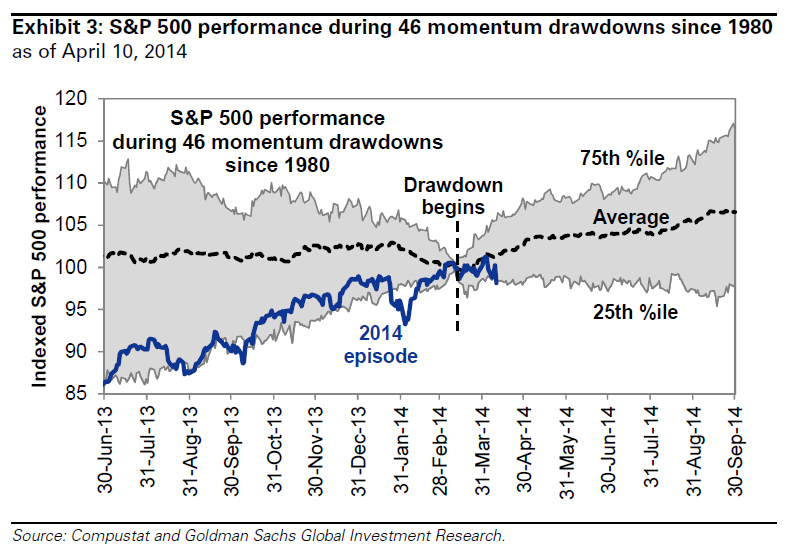
So what are the good news? Well, Goldman is bullish on the non-MOMO stocks, which it sees as rising during the next 6 months by, if history is any precedent, 5%. Of course, the market merely regaining its all time highs by October will hardly please the investor community which is used to 20%+ return year after year. After all someone must benefit from the Fed’s ludicrous actions.
S&P 500 Index performance during 46 momentum reversals since 1980 suggests the broad market will likely rise steadily during the next six months by an average of 5%. Based on a current S&P 500 index level of 1815, a 5% rise would lift the index to just above 1900 which is our year-end 2014 forecast. A 25th percentile trajectory implies a flat equity market during the next six months while tracking at the 75th percentile would see S&P 500 climb by 15% to 2090 by the end of 3Q (see Exhibit 3).
But most interesting is Goldman’s attempt to deny that this is the second coming of March 2000:
One historical momentum drawdown has come up repeatedly in recent conversations with clients: March 2000. The current sell-off in high growth and high valuation stocks, with a concentration in technology subsectors, has some similarities to the popping of the tech bubble in 2000.
Veteran investors will recall S&P 500 and tech-heavy Nasdaq peaked in March 2000. The indices eventually fell by 50% and 75%, respectively. It took the S&P 500 seven years to recover and establish a new high but Nasdaq still remains 25% below its all-time peak reached 14 years ago.
We believe the differences between 2000 and today are more important than the similarities and the recent momentum drawdown is unlikely to
precipitate a more extensive fall in share prices:
- Recent returns are less dramatic. Although the trailing 12-month returns are similar (22% today versus 18% in 2000), the trailing 3-year and 5-year returns are much lower (51% vs. 107% and 161% vs. 227%, respectively).
- Valuation is not nearly as stretched. S&P 500 currently trades at a forward P/E of 16x compared with 25x at the peak in 2000. The price/book ratio is 2.7x versus 6.Xx. The EV/sales is currently 1.8x compared with 2.7x in 2000.
- More balanced market. The reason it is called the “Tech Bubble” is that 14% of the earnings of the S&P 500 came from Tech in 2000 but it accounted for 33% of the equity cap of the index. Today Tech contributes 19% of both earnings and market cap. Top five stocks in 2000 were 18% vs. 11% today.
- Earnings growth expectations are far less aggressive. Bottom-up 2014 consensus EPS growth currently equals 9%, close to our top-down forecast of 8%. In 2000, consensus expected EPS growth equaled 17%.
- Interest rates are dramatically lower. 3-month Treasury yields were 5.9% in 2000 vs. 0.05% today while ten-year yields were 6.0% vs. 2.7% today. The yield curve was inverted by 47 bp. Today the slope equals +229 bp.
- Less new issuance. During 1Q 2000, 115 IPOs were completed for proceeds of $18 billion. In 1Q 2014, 63 completed deals raised $11 billion.
All great points, yet one thing is conspicuously missing and perhaps Goldman can clarify:
- how much debt as a percentage of global GDP was held by the world’s major central banks then and now, and
- how much consolidated global leverage, including shadow banking in both the US and China, as well as how many hundreds of trillions of derivatives notional outstanding existed then… and now
Because one can just as easily make the case that as the global financial house of cards, teetering since the great financial crisis of 2008, and upright only thanks to the explicit “wealth effect” support of the final backstop – the world’s money printers – any protracted downward move which implicitly crushes the faith in the monetary religion, and crushes the uber-leveraged smart money community, will make the “drawdown” in both momo and S&P500 stocks in March 2000 seem like a pleasant walk in the part compared to what may be coming.
Related info:
– How To Buy Bullion (What To Ask And What To Own):
As far as precious metals go, you need to:
- Own actual Bullion
- Store it yourself (not in a bank)
Only physical gold is real. Do NOT own soon-to-be worthless paper!
– Hugh Hendry: “I Have No Idea Where The Stock Market Is Going To Be”… But “I Am Long Gold And Short The S&P” (ZeroHedge, Oct 25, 2012):
One of the best presentations at this year’s Economist Buttonwood gathering (which is still being live-streamed here), was, as usually happens, Hugh Hendry. The contrarian Scotsman, who describes his style as one where he “positions ourselves outside the accepted belief system”, managed to say in 15 minutes what takes most pundits hours, and that’s without the appendices, charts, long-winded essays, and graphs. Because when it comes to conveying ideas, simplicity always wins, and few are as good at speaking in simple, logical terms, as Hugh Hendry.
– Hugh Hendry On Europe “You Can’t Make Up How Bad It Is” (ZeroHedge, May 2, 2012):
At The Milken Institute conference yesterday, Hugh Hendry delivered his usual eloquent and critical insights on the state of Europe. Beginning with the statement that “All of Europe has defaulted”, the canny-wee-fella (translation: shrewd and cautious young chap) explained that “The political economy in Europe is such that the politicians chose to default on their spending obligations to their citizens in order to honor the pact with their financial creditors and so as time goes on, the politicians are being rejected.” Between France’s election of Mr. Hollande and Luxembourg’s ‘when times get tough you have to lie’ Juncker, Hendry says the only inspiration for Europe is fiction as “you just can’t make up how bad it is” as he goes on to discuss the precedent for a way forward, the grotesque distortions of fixed exchange rate regimes, why Weimar happened, why the transfer union will never happen, Ayn Rand’s reality, and fear politicians are feeling.