– Deutsche Bank: “This Chart Is Even More Appropriate To Show A Broken Financial System“:
Yesterday, DB’s credit strategist Jim Reid (whose bank just hit a new record low stock price earlier this morning), said that “If One Wanted A Simple Indicator Of A Broken Financial System, Then This Is It”, and proceeded to show the chart of the 10 Year Bund yield, which is now well in the negative territory. Today Reid, in his quest to show how broken the global “market” has become as a result of relentless central bank tinkering, and has come up with what he believes is an even better example.
This is what he said:
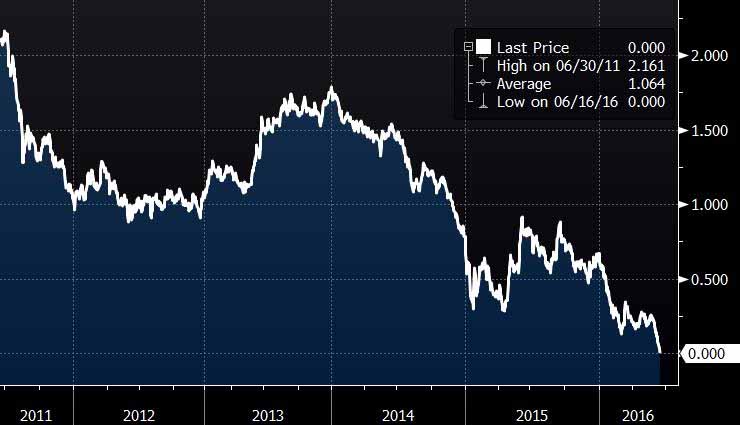
… how can i get virtually guarantee to get 100 back on an investment in the middle of this century? Well one way would be to spend 231 CHF today and buy the Swiss 2049 maturity Government bond. You have the luxury of an annual 4% coupon to ease the pain of the ginormous capital loss but over the last couple of days, this 32.5 year bond joined the negative yield club (on the ask side). Yesterday we said that the chart we published on 10 year bund yields back to 1807 was an excellent way of showing a broken financial system well maybe the chart in today’s PDF showing this Swiss 2049 bond yield is even more appropriate. You now have to pay the Swiss government for the privilege of lending to them for nearly 33 years. I wonder what the real return on that investment will be over its lifetime? All guesses welcome.

And sure enough, moments ago the 30Y Swiss bond is officially in negative territory, pushing the entire Swiss curve into negative territory.
* * *
PayPal: Donate in USD
PayPal: Donate in EUR
PayPal: Donate in GBP