
– Why Is the Put-Call Ratio (Fear Gauge) Higher Than In The Lehman Collapse Of 2008? (ZeroHedge, Oct 14, 2014):
Moments ago, the Fed concluded its latest $931MM POMO, with just 6 more POMOs left ever (at least until another QE program is unveiled), and judging by the last week’s performance, the market has finally figured this out. And Goldman, which has been pounding the table on shorting the 10 Year for about a year now, and in the process crucifying even more muppets, has some bad news for TSY shorts: global growth is crashing.
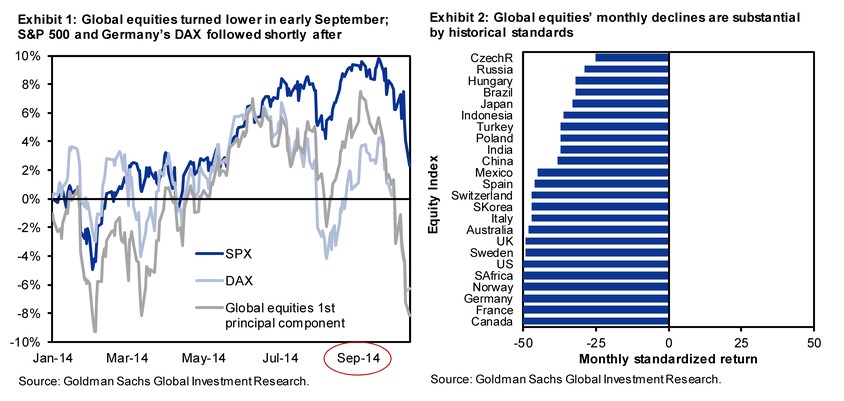
Over the last week, global equities continued to slide, prolonging a trend that started in early September, according to the “first principal component” of a set of global equity indices (see Exhibit 1). And more recently, the S&P 500 and Germany’s DAX have succumbed to the pressure too, after a period of relative resilience. Declines have picked up steam. Over the last month, many of the markets we track experienced monthly declines that rank in the 5th percentile or worse, relative to their own past histories (see Exhibit 2). The S&P 500, DAX, and Canada (amongst others) had 1st percentile-sized declines. Said differently, monthly sell-offs of this size occur about once every five years.
Visually:
This is how Goldman explains the series of stunning charts:
This re-pricing of the equity market’s view of growth has far outpaced the small tick lower in the GS Current Activity Index, which dropped a quarter-point to 3.25% in September (owing in large part to a sharp drop in the US PMI).
Perhaps it simply means that the GS Current Activity Index was woefully inaccurate and misrepresenting a rebound that was clearly never going to take place?
So what then? Well, if the market is correct, expect a complete collapse in US economic indicators: “later this week, the first early macro numbers for October, including the Philadelphia Fed survey, will help us gauge the equity market’s sell-off in the context of the macro data picture. The consensus view calls for a slight deterioration in the Philly Fed survey, but the equity market’s growth selloff of appears to go well beyond this deterioration too.”
Explanations aiming to crucify more muppets aside and to justify rumors of yet another QE program from the Fed in the coming weeks (due to Russia, Ebola and, gasp, another harsh winter just around the corner) here is what is going on in the world according to Goldman’s Wavefront US Growth Basket:
![]()
But it’s not just the US that is in freefall: so is the entire world.

So…. when is the Fed hiking rates again?