– Is This The Top? First Quarter Corporate Profits Tumble Most Since Lehman (ZeroHedge, June 3, 2014):
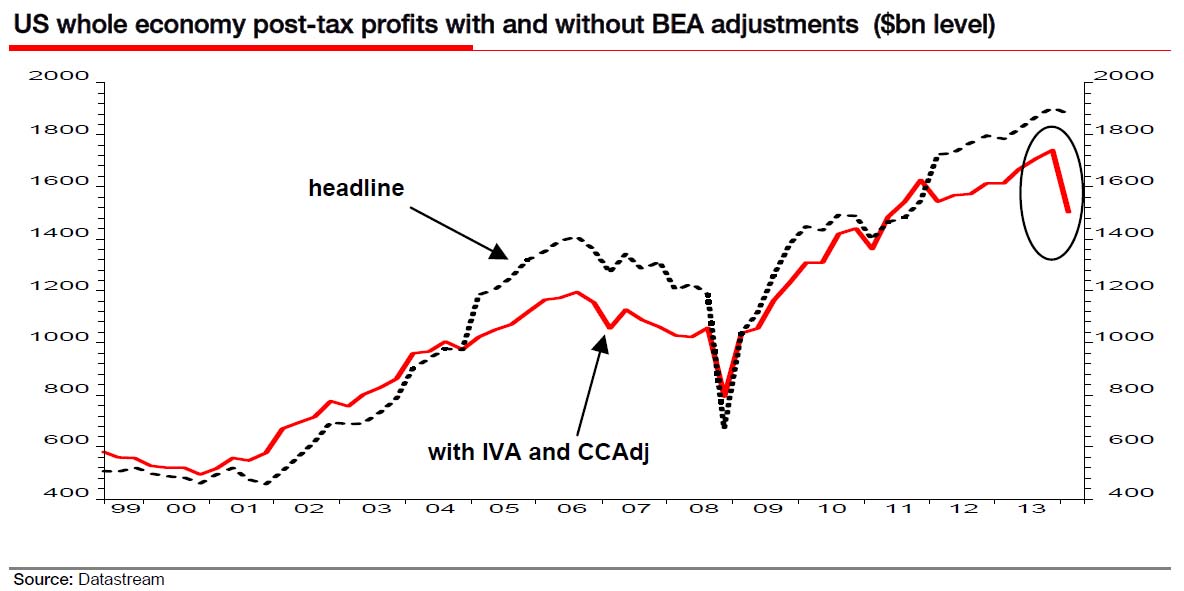
As SocGen’s Albert Edwards conveniently points out, during the excitement of the downward revision of Q1 US GDP from +0.1% to -1.0% investors seem not to have noticed a $213bn, 10% annualized slump in the US Bureau of Economic Analysis’s (BEA) favored measure of whole economy profits, defined as profits from current production. Also known as economic profits, the BEA makes adjustments to remove inventory profits (IVA) and to put depreciation on an economic instead of a tax basis (CCAdj). Edwards shows the stark difference between the BEA’s calculation for post-tax headline profits (up 5.3% yoy) and economic profits (down 6.8% yoy) in the chart below. In short: the plunge in actual corporate profits in Q1 was the biggest since Lehman!
It is not just SocGen’s bear who observes this surprising finding: Goldman is on it as well.
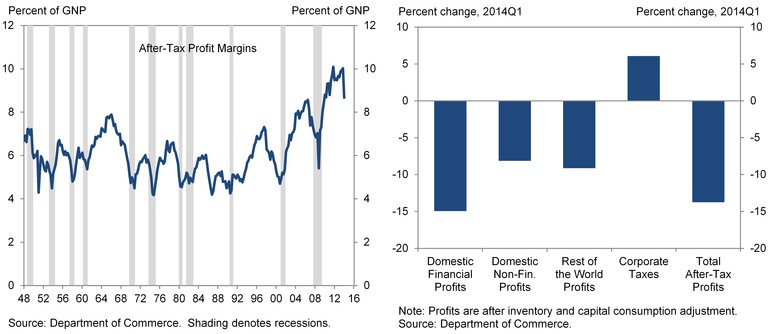
Last Thursday’s second release of the Q1 national accounts showed a 14% decline in the BEA’s measure of adjusted, after-tax corporate profits. In just one quarter, profit margins dropped from 10% to 8.7% of GNP…. The chart on the left of Exhibit 1 shows that the Q1 dip in profit margins was unusually large. As the chart on the right shows, the decline was felt across-the-board, with corporate profits in the domestic financial sector suffering the sharpest drop and domestic non-financial and rest-of-the-world profits showing large declines as well. In addition, corporate taxes rose as a share of profits, accounting for about one-tenth of the decline in after-tax profits.
Goldman is quick to note two reason why it hopes this inflection point does not signal the end of record profit margins:
- The decline was driven by statistical adjustment factors. The first reason is that the decline in corporate profits as measured in the national accounts mostly reflects the capital consumption adjustment factor estimated by the BEA to account for the effect of the expiration of bonus depreciation at the end of 2013.
- Q1 weakness should be temporary. Growth and productivity were unusually weak in Q1, which likely weighed on profits, but both should strengthen going forward. As we argued recently, Q1 weakness was mostly driven by temporary factors, while more recent data suggest that the acceleration is intact.
What is most perplexing is that while corporate profits will eventually decline it is expected that they will do so at the expense of rising wages. This is not happening: To wit: “Wage growth remains soft. Our wage tracker–an aggregate of average hourly earnings, the employment cost index, and nonfarm business compensation per hour–rose only modestly in 2014Q1 to 1.8%. As we previously noted, this is about 2 percentage points below the rate at which labor costs would begin to consistently eat into profit margins.”
If anything this is confirmation that there is far less slack in the economy than widely believed, and that corporate profitability can collapse even without a comparable increase in much needed wage inflation (the basis for David Rosenberg’s conversion from a deflationist to inflationist).
So Goldman spin aside, what is really happening? For the real answer we go back to Albert Edwards who is kind enough to explain:
Having spent the best part of 25 years following US whole economy profits I feel I have a good understanding on what exactly is going on. I was however most surprised at the divergence in the two key series shown on the front page chart. After a very long chat with a very helpful person from the BEA, she emailed me to “note this quarter, there is a substantial difference between profits from current production (that include IVA and CCAdj) and profits before tax (that exclude IVA and CCAdj) due to the expiration of investment incentives that allowed companies to accelerate depreciation over the past several years. As provisions of the tax acts from 2002, 2003, 2008, 2009, 2010, and 2012 expire, and as no new provisions are introduced, businesses are now expensing less depreciation for tax purposes. As a result, tax based depreciation expense, measured as CCA, is falling, while economic depreciation expense, measured as CFC, continues on a steady growth trend (see charts below). The difference between these two measures is the CCAdj. With economic depreciation expense higher than tax based depreciation expense, BEA’s measure of corporate profits with CCAdj shows a decline, while profits excluding CCAdj show an increase.”

The punchline: “headline reported profits are currently artificially inflated upwards to show a roughly 5% yoy increase, which is incidentally the same pace that the MSCI trailing reported stockmarket profits are rising by – both are misleading investors as to the underlying strength of profits.”
Or, said simply: accounting gimmicks relating to the tax treatment of accelerate depreciation managed to boost paper, not real, profits artificially higher. And now that the gimmick is no longer there, profits are finally reverting to a reality-based trendline.
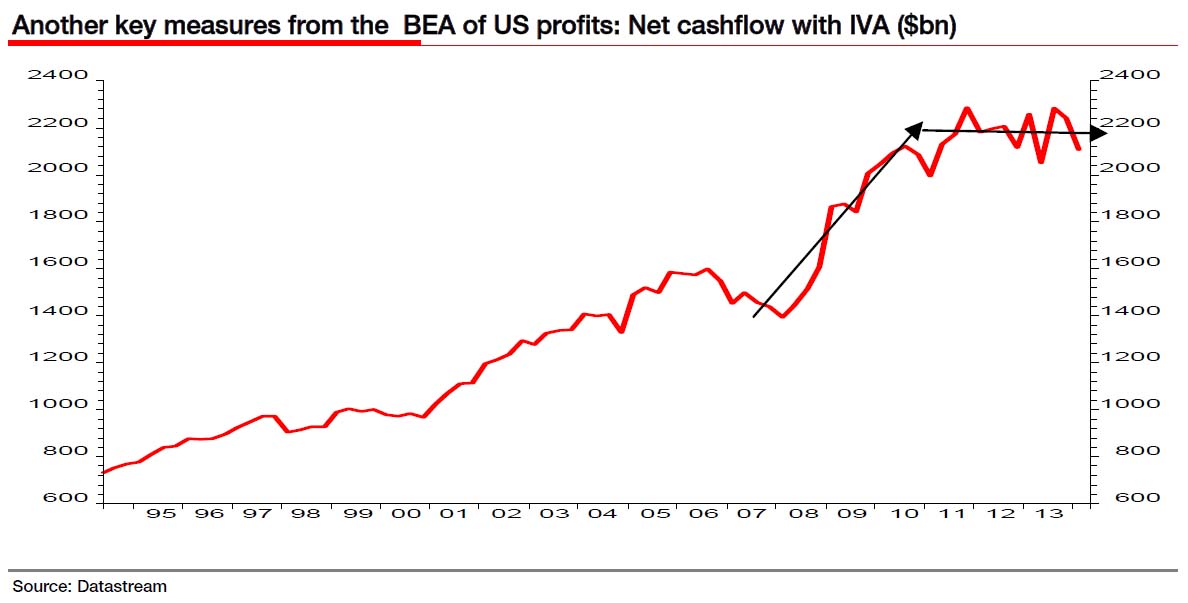
But wait it gets worse: when looking at pure cash flow – the hardest to fudge corporate data point – the chart speaks volumes:
Edwards again:
The BEA press release itself describes net cashflow with IVA as “the internal funds available to corporations for investment (calculated as after tax profits with IVA and CCAdj, net of dividend payments but plus depreciation on an economic basis (CFC))”. We can see from the chart above that this decreased by $132bn in Q1 following a decrease of $43bn in Q4. This key measure of internal funds available for investment has stalled badly over the last two years (see chart above). No wonder US business investment has been struggling recently. The bottom line is that the US profits margin cycle has begun to turn down at long last (see chart below). It is doing so from elevated but not unprecedented levels – especially the nonfinancial part of the economy (my former colleague Leo Doyle always told me I had to add depreciation into the profits numerator as the denominator GDP was also measured gross of depreciation – i.e. the G in GDP!)
And visually – this chart is comparable to the Goldman one, only it looks at GDP not GNP and has profits on a pre-tax, not after-tax basis.

But why did nobody notice this earlier? We go back to Edwards for one final time:
Just about everyone I know, except my wife, has seen the Star Wars films and knows the scene when Obe Wan gets through a stormtrooper checkpoint using his Jedi powers –
Stormtrooper: Let me see your identification.
Obi-Wan: [with a small wave of his hand] You don’t need to see his identification.
Stormtrooper: We don’t need to see his identification.
Obi-Wan: These aren’t the droids you’re looking for.
Stormtrooper: These aren’t the droids we’re looking for.
Obi-Wan: He can go about his business.
Stormtrooper: You can go about your business.
Obi-Wan: Move along.
Stormtrooper: Move along… move along.
As Obi Wan might have said, “US Profits are not declining. China is not devaluing. There is nothing to see here. Move along and continue to party.”