– Map shows Fukushima fallout in U.S. — Radiation dose in Northeast and Great Lakes equal to West Coast (GRAPHIC) (ENENews, Jan 29, 2014):
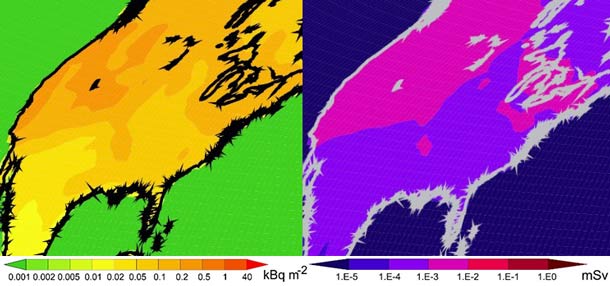
Global and local cancer risks after the Fukushima Nuclear Power Plant accident as seen from Chernobyl: A modeling study for radiocaesium (134Cs & 137Cs), Nov. 29, 2013: […] The highest deposition was found in the pixel of Fukushima (in the range of MBqm²), where deposition exceeded the contamination limit affecting an area with more than 9 million inhabitants. In the West USA the deposition was found between 100 and 500 Bq m² decreasing to the East. For the South-west USA, Wetherbee et al. (2012) reported that the deposition of 137Cs was 30–240 Bq m² and 2–46 Bq m² for 134Cs, which is in the same order as in our calculations (Fig. 1). The same investigators reported a deposition of 137Cs in Alaska to be 16–27 Bq m² and around 55 Bq m² for 134Cs similar to those presented here (50–100 Bq m²). In the rest of the US they measured 137Cs between 1 and 45 Bq m² and 134Cs between 1 and 3 Bq m², which are close to ours (50– 200 Bq m²) […] According to the French Institute of Radioprotection and Nuclear Safety (IRSN, 2012) approximately 73 radionuclides were released after Fukushima. Therefore, one might argue on the low impact concluded in our study claiming that only radiocaesium has been studied instead of the 73 radionuclides emitted. […]
Scientist Marco Kaltofen found areas with considerably higher radiocesium deposition than 500 Bq/m². See: University Researcher: Portland-area topsoil with up to 8,000 pCi/kg of cesium from Fukushima — Over 10,000% higher than highest levels found by UC Berkeley