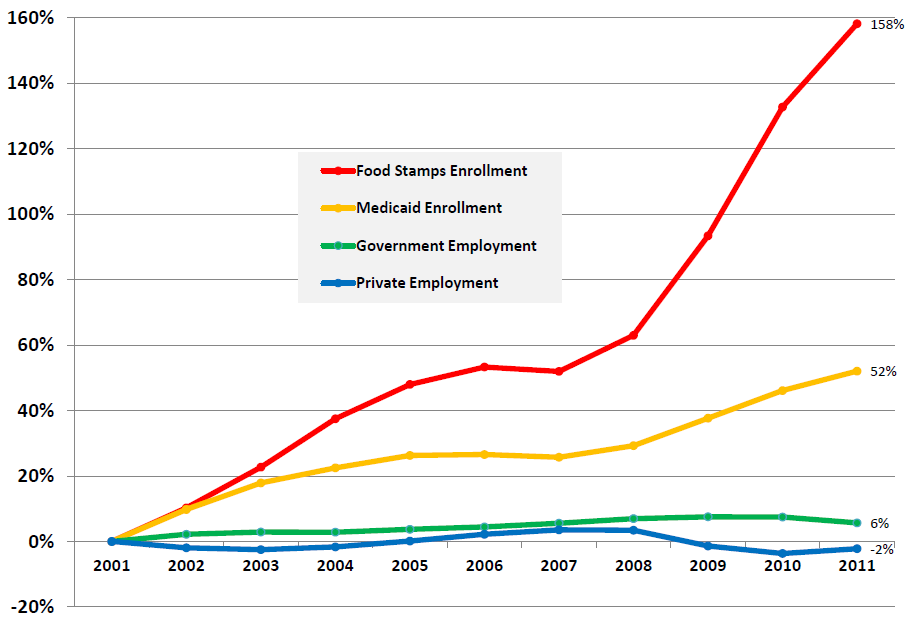
– America’s Lost Decade In One Simple Chart (ZeroHedge, Nov 28, 2012):
Forget the stock market’s dismal decade of much-ado-about-nothing and ignore the USD Dollar’s declination; when it comes to reflection on what this once great nation has ‘created’ since 2001, the following chart from Pennsylvania’s Department of Public Welfare sums it up better than most.
See also:
– Why $16 Trillion Only Hints At The True U.S. Debt (Wall Street Journal, Nov 26, 2012):
“The actual liabilities of the federal government—including Social Security, Medicare, and federal employees’ future retirement benefits—already exceed $86.8 trillion, or 550% of GDP. For the year ending Dec. 31, 2011, the annual accrued expense of Medicare and Social Security was $7 trillion. Nothing like that figure is used in calculating the deficit. In reality, the reported budget deficit is less than one-fifth of the more accurate figure.”
– US National Debt At $14 Trillion? Try $211 Trillion!!! (NPR, August 6, 2011):
“If you add up all the promises that have been made for spending obligations, including defense expenditures, and you subtract all the taxes that we expect to collect, the difference is $211 trillion. That’s the fiscal gap,” he says. “That’s our true indebtedness.”
– Prof. Kotlikoff: ‘The US is bankrupt’, Government Debt At $200 Trillion – 840 Percent of Current GDP (The Globe And Mail, Oct 27, 2010):
Boston University economist Laurence Kotlikoff says U.S. government debt is not $13.5-trillion (U.S.), which is 60 per cent of current gross domestic product, as global investors and American taxpayers think, but rather 14-fold higher: $200-trillion – 840 per cent of current GDP. “Let’s get real,” Prof. Kotlikoff says. “The U.S. is bankrupt.”
