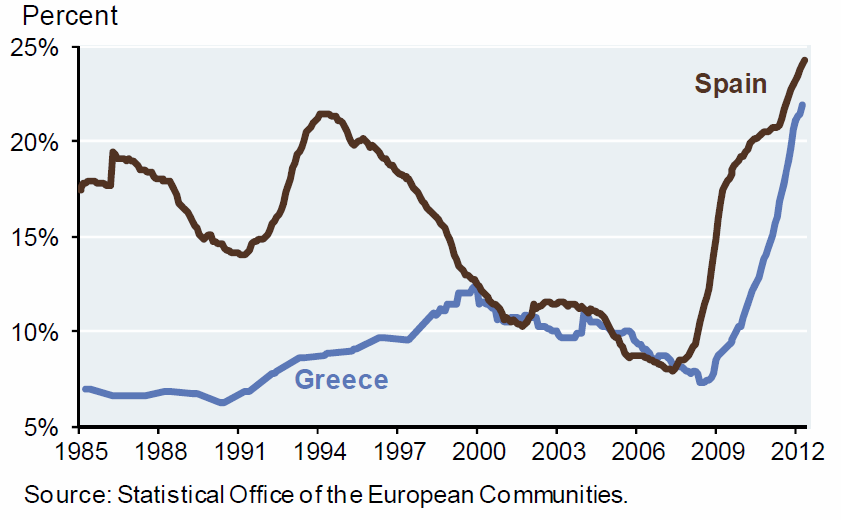
– The Two Scariest Charts In Europe (Got Scarier) (ZeroHedge, June 25, 2012):
It seems, as JPMorgan’s CIO Michael Cembalest notes, that ahead of yet another EU Summit; everyone understands now why Europe matters (even the once-bloviating decoupling diehards). The summit is likely to focus on bank recapitalization, easier repayment timetables for Greece, bank deposit guarantees and an alleged “roadmap” for EU integration. The challenge, Cembalest confirms, is that Germany cannot afford a blank check given debt levels already over 80% of GDP. However, if policymakers don’t do something about growth in the Periphery (bailouts primarily designed to aid German and French banks don’t count), the North-South divide will continue to widen, putting pressure on the ECB and EU taxpayers. Sometimes there are no easy answers. Italy, Spain, Greece and Portugal are contracting at a 2%-5% annualized pace, and unemployment in Spain and Greece is sky-rocketing (1st chart). These levels are notable from an historical perspective. As shown in the 2nd chart, 20%+ unemployment was the level at which National Socialists in Germany began to take seats away from liberal democratic parties during the 1930’s. If the jobs picture does not improve, other EU policy decisions may not matter much (as we noted six months ago)!
Spanish and Greek Unemployment
Unemployment and The End of Liberal Capitalism 1930s
Source: JPMorgan
Finally for all those who vehemently claim this can never happen in Europe, feel free to click on the logo below:


